Performance Marketing Measured
SEO Needed’s marketing team first designs a client website for optimal SEO reach and results. If you have secured a Service Plan with us, you also get the second part of this equation, which is a monthly oversight and advisory of the best performance marketing elements at your disposal.
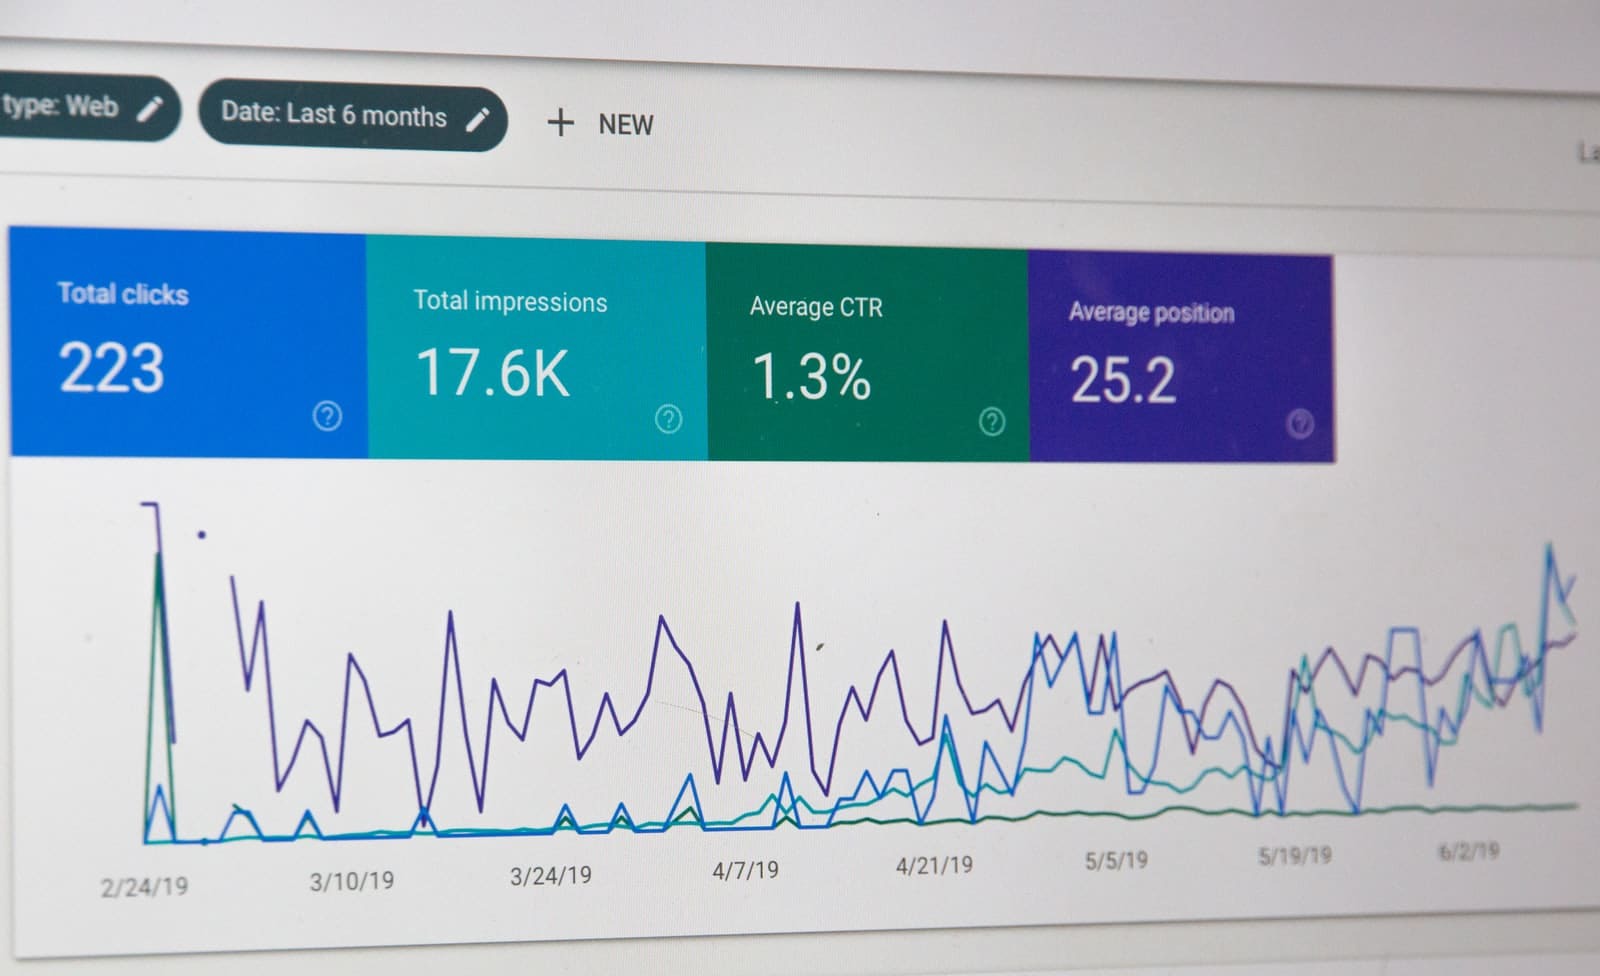
As we approach the end of the first semester, you should perform a Google Analytics and Search Console results review. Given the scalability of these metrics, you can take a look at what went on during first half of the year or you can compare month to month or year to year for improvements, stagnations or deficits. Remember: generically, Google Analytics interprets website usage hard numbers in the hopes of boosting traffic and web presence through clicks. Meanwhile, Google Search Console focuses on impressions and how your site interacts with keyword and search results users, underlining problem areas, opportunities for improved visibility, and the ebb and the flow between search engine ranking and optimization.
These are the top 5 most useful metrics according to SEO Needed. They will help you assess your SEO performance on Google Analytics and Google Search Console.
- Bounce Rate (Analytics)
This metric measures the percentage of users that visit a single page and then leave. It is found in the Overview of the Audience section. It informs you if people are turned off (or on) by your home or landing page. Causes are varied: users may be having trouble getting the information/content they need, there is no visible CTA, there is a technical error, or user targeting for marketing campaigns is all off. It may also be relevant to check the Browser metric, to see if the page is performing poorly on certain browsers and fine on others.
- Most Viewed Page (Analytics)
You can find this metric under Top 10 Landing Pages in the Behavior section. As you ascertain which page(s) is doing right by you, you can evaluate user experience, content quality, marketing campaign efficacy, design adequacy, and more. This also allows SEO Needed’s marketing team to review and analyze for new opportunities like CTA banners or forms.
- Most Searched Keyword (Search Console)
Find this metric in the Search Traffic section within Search Analytics, a report that will give you a wealth of useful information. Parameters like queries, pages, country, device, date range and search type will feature in addition to the keyword(s) that is really driving traffic and impressions. Keywords are substantial tells: you should see which ones are working and look for iterations, and then you should change or drop those that are not.
- Referral & External Links (Analytics & Search Console)
These 2 separate metrics are aptly named: Links to Your Site, found in the Search Traffic section of Search Console, and Referrals, under All Traffic, in the Acquisition section of Analytics. From an analytical perspective, they are of capital importance to analyze SEO work performance, heeding things like brand visibility, rewarding loyalty, and building strong relationships. For strictly metrics, check for the total number of links, how they are linked, and which outside website links to which domestic page the most.
- Conversion Rate (Analytics)
Tracking Goal Conversion Rates is done in the Behavior section of Analytics. In this wording, goals are targets that help you define your marketing objectives. They span all the way from converting leads to pinning down clients through purchases, and everything in between. This metric is normally a factor of many preceding ones, so it tends to come later on in a report, after you have analyzed other criteria to help you explain conversion.
Bonus Metric:
Newsletter Opens (Analytics)
Found in Events, in the Behavior section, this is a growingly important metric for all those companies that are actively producing relevant content for clients and leads because it helps you measures the success of your emailing campaigns. You can break down this metric in several ways, but perhaps one of the most helpful today is by device. It allows you to determine, for example, if your campaign is achieving solid click-through rates on mobile devices versus desktops or tablets or vice versa.
Sources:


